
The Hypergamy Chart Explained: What the Arrows Get Wrong

Lifemaxxing
Arrow Math
The hypergamy chart is everywhere again: sad dogs, rural villages, Halloween costumes. Here is where it came from, what the dating data actually says, and why it makes a terrible life plan.
Key takeaways
- The hypergamy chart shows men happy to date women around their own level while every woman's arrow points at the same few top men. It started on Reddit in 2018 and blew up again as a meme in 2026.
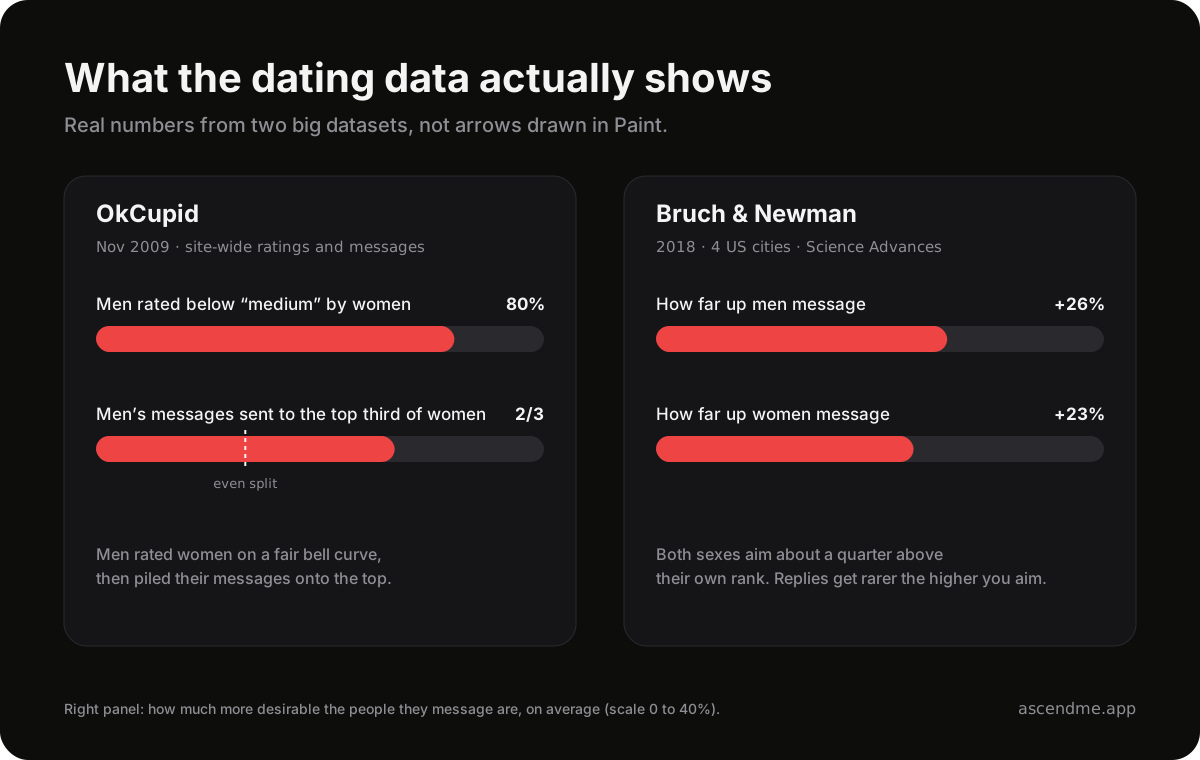
- Real dating data is messier. On OkCupid, women rated most men below average, but men were the ones sending two-thirds of their messages to the best-looking third of women.
- A 2018 study found both men and women message people about 25% more desirable than themselves. Apps reward the top, but nobody's arrows are as tidy as the chart.
What the hypergamy chart actually shows
The chart is two panels of stick figures, stacked from most to least attractive. On the left, under whom men would happily partner with, every man has arrows pointing at women on his own level and the levels next to it. Tidy and weirdly wholesome.
On the right, under whom women would happily partner with, every woman's arrows go to the same top few men. Everyone below gets no arrows at all. Some versions add an expectation line, where anything above counts as a catch and anything below counts as settling. Online, the empty bottom row picked up its own nickname, and it is not a kind one.
That is the whole argument in one image. Men date across the board, women only date up, so most men lose. It is easy to repost and feels like a secret someone finally drew.
Where it came from and why it is back
The first known version was posted on November 19, 2018 in r/WhereAreAllTheGoodMen, pitched as a visual aid for newcomers. It got around 150 upvotes and then lived quietly in manosphere corners for years, with Alvin and the Chipmunks parodies popping up in 2024 and 2025.
In 2026 it became a full meme format. A May video of a sad dog learning about hypergamy passed 2.5 million views, a frog version followed in September, and an October clip of a guy spotting the chart in the clouds hit 2 million views in five days. On X, people now post the hypergamy chart of my village and joke about wearing it as a Halloween costume.
So it lives two lives. Half the internet treats it as a joke about doomposting. The other half, mostly blackpill and looksmaxxing spaces, reposts it as settled science.

What hypergamy actually means
In sociology, hypergamy just means marrying up: into a higher class, caste or education level. Online it got stretched into women only want the top men, which is a much bigger claim.
The classic version has been shrinking. Researchers who studied census data from 120 countries between 1960 and 2011 found that as women overtook men in education, the old pattern of wives having less schooling than their husbands faded and in many places flipped. Other demographers argue the preference never went away and only looks smaller because there are more educated women around. Either way, women only marry up does not survive contact with the marriage data.
What the dating data actually shows
Two datasets get closer to the chart's claim than anything else, and both are more interesting than the chart.
OkCupid published its users' ratings in 2009. Men rated women on a fair bell curve, with most women landing around medium. Women were brutal: they rated about 80% of men as worse-looking than medium. That stat is the one chart posters love.
They skip the next part. When it came to actually messaging, women aimed only slightly above the middle. Men went for the top: they sent two-thirds of their messages to the best-looking third of women. On the site that made the 80% stat famous, men were the ones piling onto the top.
A larger 2018 study in Science Advances ranked users in four US cities by how much attention they got and from whom. Men messaged women about 26% further up the ranking than themselves, and women messaged men about 23% further up. The most common contact was someone at your own level. Replies got rarer the higher people aimed, and men writing to more desirable women never got above a 21% reply rate.
The same study found the age curves the manosphere loves to quote. Women's desirability on the site fell steadily from 18, while men's peaked around 50. More education always helped men. For women, a college degree helped and a postgrad degree did not.
The part the chart gets right
Apps concentrate attention. A small slice of profiles gets flooded while plenty of decent guys get a trickle of matches. Women on OkCupid really did rate most men harshly. Swiping on a photo strips out humor, voice and status, so looks and photos carry more weight than they would at a party.
If the chart makes you feel like apps are stacked against an average guy with bad photos, you are not imagining it.
The part it gets wrong
- Men's arrows are far less generous than drawn. In both datasets men aim up too, and on OkCupid they chased the top harder than women did.
- It shows app messaging and calls it life. Studies of real couples have long found partners tend to be similar in attractiveness, and even in the 2018 data the most common contact was someone at your own level.
- Rows move. The chart freezes you in place, but app desirability shifts with photos, body fat, style, age and what you have going on. Those are the exact things a normal guy can change.
- It turns an attention problem into a worth problem. Getting fewer matches is a distribution issue. Calling the bottom row subhuman is just doom with a diagram.
What to do with it if you are a normal guy
- Fix the photos first. Daylight, five feet away, a real smile, one full-body shot. The proportionmaxxing guide explains why close selfies wreck your face.
- Lean out and sort your hair and skin. These change how people rate you faster than anything on a chart. The HTN tier breakdown covers what moves people up.
- Message your level and a bit above. Aiming a little up is normal for everyone. Aiming only at the top is how men end up stuck at a 21% reply rate at best.
- Get offline reps: friends of friends, run clubs, classes, parties, anywhere your voice and humor count. Charismaxxing beats another chart thread.
- Build a life worth joining. Money, skills, friends and hobbies are what make someone stay after the first date, and lifemaxxing is the long game.
How AscendMe looks at this
The chart asks you to accept a row and stay there. AscendMe is built on the opposite bet: track the things that change how you come across, week after week, until the photos and the mirror both show it.
Training, food, skin, sleep, style and progress photos all feed one Ascend Score that rises with effort. Less arrow math, more reps.
Receipts
A few outside sources worth opening if you want the less-forum, more-grounded version.
Frequently asked questions
What is the hypergamy chart?
The hypergamy chart is a meme diagram first posted on Reddit in 2018. It shows men willing to partner with women around their own level while every woman's arrows point to the same few top men.
Is the hypergamy chart true?
Partly. Dating apps do concentrate attention on a small group, and on OkCupid women rated most men below average. But research shows both men and women message people more desirable than themselves, and on OkCupid men aimed at the most attractive women even harder than women aimed at the top men.
What does hypergamy mean?
Hypergamy means marrying or dating someone of higher status, such as a higher class or education level. Online the word is often stretched to mean women only want the most attractive or highest-status men.
Where did the hypergamy chart come from?
The first known version was posted on November 19, 2018 in the subreddit r/WhereAreAllTheGoodMen. It became a viral meme format on TikTok, Instagram and X in 2026.
Do men also date up?
Yes. A 2018 study of online daters in four US cities found men contacted women about 26% more desirable than themselves, slightly more than the 23% for women.
Filed under
Lifemaxxing · hypergamy chart / hypergamy / hypergamy meaning